2D Technical Data display for Line Graphs, Charts, Histograms
GINOGRAF is a set of functions for displaying 2D numerical data in a range of graphical forms and to enhance users data display needs with the minimum of programming effort.
Extruded Bar charts, pie charts, X-Y graphs, vector diagrams, histograms, step, area, text and polar charts can all be generated from a single call. Alternatively, a whole host of composite routines are available which offer further control of position, scaling and labelling of axes, line styles and symbol types, curve fitting characteristics, colour and solid fill capabilities, linear and logarithmic scales and titling.
Used in conjunction with the interactive and GUI features of GINOMENU can produce a powerful application for your demanding data-driven needs.
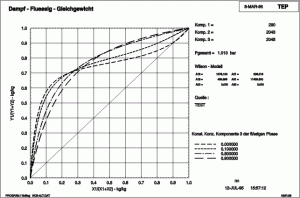
Line Graph
Simple 2D line graphs can be produced very quickly with very few function calls. However the power of GINO is demonstrated by using the low-level functions giving control over every aspect of the graph. Curve types, Line styles, axes annotation, labelling, titling and font-control can all be adjusted to suit the exact requirements for a professionally produced document.
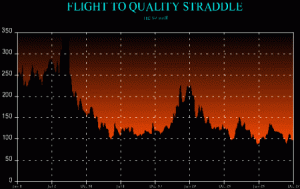
Colour Filled Line Graphs
Used in conjunction with GINO functions for colour, filling, masking, thick-lines, circles and arrows, a simple line graph quickly becomes easier to read and gives a more professional appearance.
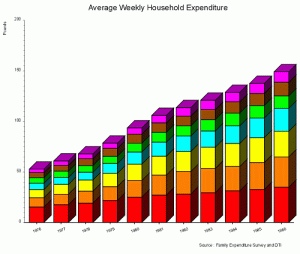
Histogram
Various forms of histograms can be produced including single-line, filled, multi-filled (as shown), stacked and block filled. The histograms can be annotated with their value or user-defined strings and the usual control is available for the axes, annotation, labelling and titling.
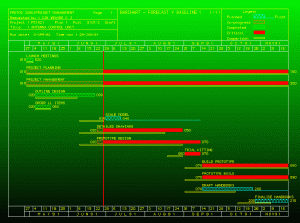
Bar Charts
Various forms of bar-charts can be produced including outline, filled (shown) and block filled. The charts can be annotated with start, finish or length values or user-defined strings can be added anywhere on the chart.
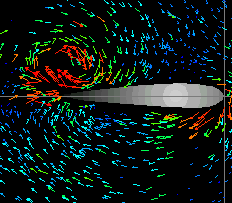
Vector Diagrams
A Vector diagram is a form of chart containing vectors or scalars representing a grid of directions, strengths and colours providing a means of displaying five sets of information on one chart. Vectors are drawn as arrows which can have an open, closed or filled head.
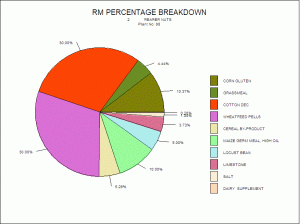
Pie Charts
Various forms of pie charts can be produced either empty, hatched or filled. Segments can be exploded (shifted away from the centre) to emphasise certain data sets and labelling of segments can be radial (along the angle), internal (either with or without a mask box) and external. Annotation can have automatic prefixes and suffixes applied and a key or legend can be generated if required.
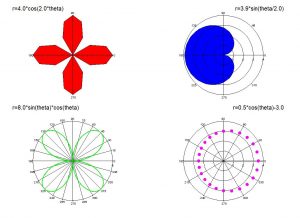
Polar Plots
Polar charts can be represented in various ways including curves, straight lines, symbols or filled areas. Control is given over the radial and theta axes as to whether they are drawn, the type of annotation and the type of tick marks.
Data Set Filling
The area under a line or curve can be filled either to a baseline or to another data set line to provide a dramatic visual effect. In this example, the whole picture has been given a graduated background fill and then the graph dataset has been filled underneath back to black.
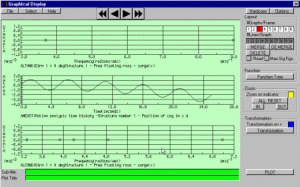
RealTime Control
Used in conjunction with the available GUI controls from GINOMENU, Large datasets or realtime data can easily be handled by using play, rewind and fast-forward type buttons. The graph can be updated instantaneously giving immediate visual results of any part of the data.
Combine with GINOMENU
Combining GINOGRAF with GINOMENU gives a powerful combination of graph-drawing and user-interaction to provide professional looking applications.
Additional Features
Export plots to DXF, WMF, CGM, BMP, JPG, PNG and Postsript formats
Print to any Windows printer or plotter
Combine any number and any type of plot on a single page
Full screen cursor or mouse interaction for data and point enquiry
Define custom line styles and colors
Add Text anywhere on the plot using TrueType fonts
Include superscripts, subscripts and Greek or other characters in text
Multiple scales on same axis
Assign segment IDs to chart components for grouping, selecting, picking and enquiring